Spring AI Series: #6 Observability: Spring AI and Beyond; with Grafana, Prometheus, Loki and Tempo
This blog is part of a series on Spring AI. Check out the previous article in this series: Model Context Protocol (MCP) [and Tool Calling 2].
Observability is crucial for any user facing system, and the job gets even harder with microservices architecture and with high traffic. To make our lives easier, we rely on various observability tools to monitor our systems so that we can take action before user experience takes a hit. LLM-driven AI systems introduce a unique problem here. AI hallucination is real, and since prompt engineering is more of an art than science, these GenAI based tools’ behavior in the wild isn’t deterministic. So, keeping a close eye on the system becomes even more important. Then there’s the economic part of it too. If you’re using the cutting edge LLMs provided by OpenAI or Google, you are paying them by the every input and output token. So, now that’s another thing to keep an eye on.
Fortunately, Spring AI makes our lives a lot easier in this regard. All we have to do is to have a observation pipeline up and running, and that’s where you’ll be spending most of your time. Configuration on the Spring AI side is very minimal to say the least.
There are 3 basic components to monitor when it comes to observability-
- Metrics - Observing the system metrics, basically to monitor resource usage
- Logs - Observing the application logs to keep an eye on errors and faults
- Traces - Observing the application or system activity. Traces are much more detailed and gives a more granular picture of the system behavior.
What we’ll do in this installment, is we’ll set up a observability pipeline, covering each of these 3 components, with Grafana in the center.
Dockerizing Both of Our Java Applications
Before going into the observability setup, we’ll quickly define the applications in our docker compose.
mcp-server:
  depends_on:
    postgres:
      condition: service_healthy
  build: ./mcp-server
  container_name: mcp-server
  restart: on-failure
  networks:
    - agent-network
  ports:
    - "8081:8081"

chat-client:
  depends_on:
    ollama:
      condition: service_healthy
    cassandra:
      condition: service_healthy
    postgres:
      condition: service_healthy
  build: ./chat-client
  container_name: chat-client
  restart: on-failure
  networks:
    - agent-network
  ports:
    - "8080:8080"
Checking if our Ollama, Cassandra and Postgres instances are healthy may take a little bit of improvisation. Just having the containers up don’t mean they are ready to serve. I’ll share my experience on this in the future, but you can go check the code repository right away if you’re interested.
Each of this application will have a Dockerfile in it, that will build the project, produce a jar, and deploy the jar.
FROM gradle:jdk17 AS builder
COPY src /usr/src
COPY build.gradle /usr/
WORKDIR /usr/
RUN gradle clean bootJar

FROM eclipse-temurin:17-jre
COPY --from=builder /usr/build/libs/app.jar /usr/app.jar
ENTRYPOINT ["java", "-jar", "/usr/app.jar"]
We can now start setting up observability.
Metrics Collector (Prometheus)
Prometheus has been an widely used monitoring and alerting tool for a while now. We’ll use it as our metrics collector. Usually, in the context of JVM applications, Prometheus is particularly useful for system health monitoring. On top of that, thanks to Spring AI, we’ll be able to monitor various API usage metrics through Prometheus.
First, let’s add Spring Actuator and micrometer registry for Prometheus to our application.
implementation 'org.springframework.boot:spring-boot-starter-actuator'
implementation 'io.micrometer:micrometer-registry-prometheus'
And, in the application properties, we’ll add some new entries -
management.observations.key-values.application=mcp-server
management.endpoints.web.exposure.include=*
management.endpoint.health.show-details=always
management.metrics.distribution.percentiles-histogram.http.server.requests=true
management.metrics.distribution.percentiles-histogram.http.client.requests=true
Basically, we’re exposing all kinds of data (metrics, threaddump, prometheus etc.). This will help you to explore all different kinds of data exposed by Spring Actuator. For
this application, only health,info,metrics,prometheus would have been enough. Once this is done and the application is up, you can visually explore all this data at the
/actuator/{exposed_data} endpoint. For example, the data that our Prometheus instance will ingest and parse will be at /actuator/prometheus.
This is all the setup we need on the application side. We’ll have to do these same changes in our Blog (and MCP server) application and our LLM driven chat client application, since we would like to monitor both. Now let’s configure a Prometheus instance in our docker compose file.
prometheus:
  networks:
    - agent-network
  image: prom/prometheus:latest
  container_name: prometheus
  ports:
    - "9090:9090"
  volumes:
    - ./entrypoint-setup/prometheus.yml:/etc/prometheus/prometheus.yml
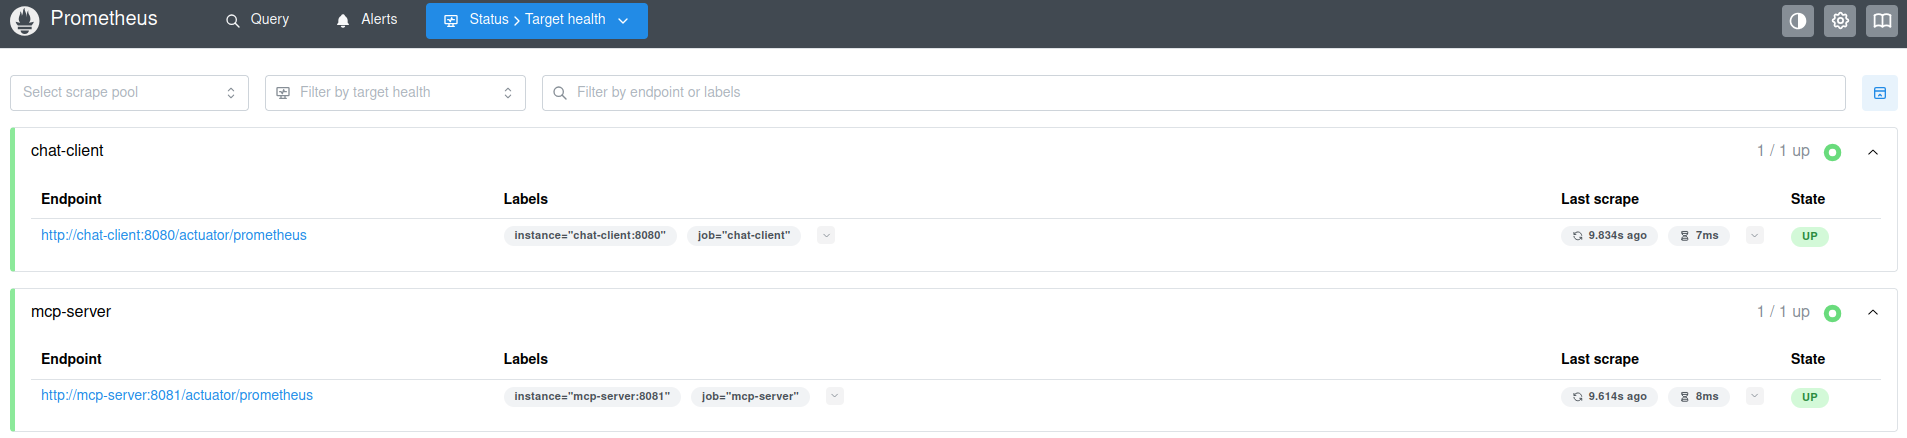
And, we’ll have that configuration file prometheus.yml at the /entrypoint-setup directory that we had created. We’ll configure both of our application here.
scrape_configs:
  - job_name: 'chat-client'
    metrics_path: '/actuator/prometheus'
    scrape_interval: 10s
    static_configs:
      - targets: ['chat-client:8080']

  - job_name: 'mcp-server'
    metrics_path: '/actuator/prometheus'
    scrape_interval: 10s
    static_configs:
      - targets: [ 'mcp-server:8081' ]
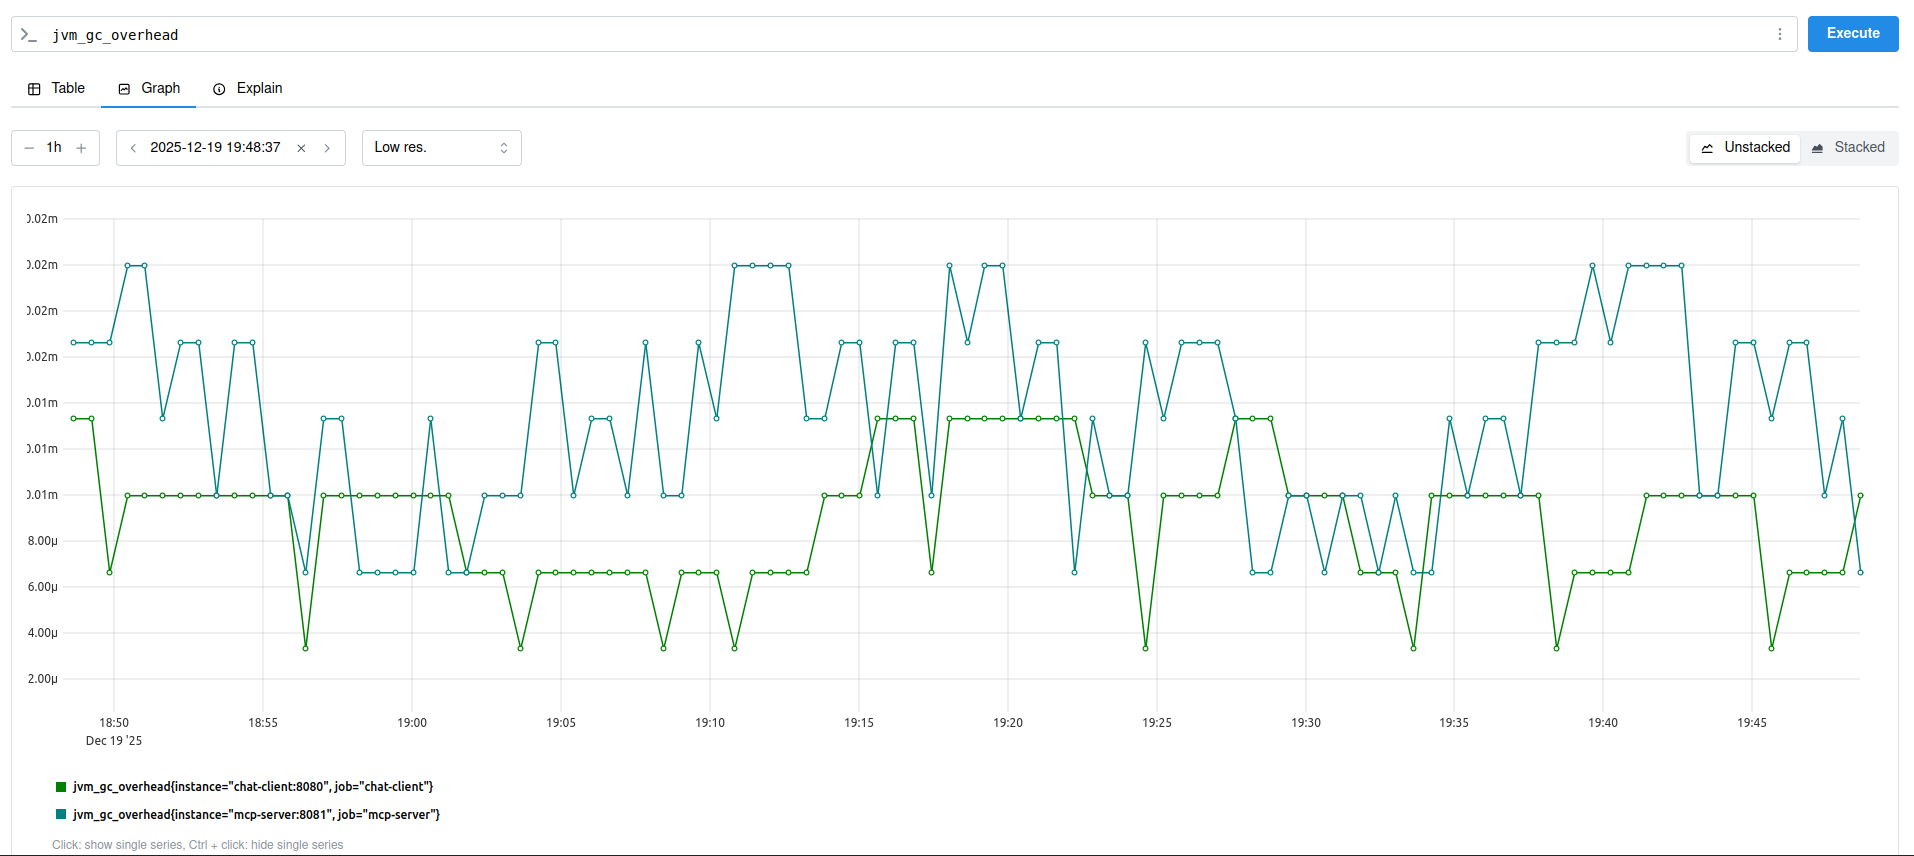
Now, you can explore Prometheus in all it’s glory! Just by itself, Prometheus can be extremely helpful to monitor your applications.
Log Aggregator (Grafana Loki)
Let’s have our Loki instance up first.
loki:
  image: grafana/loki:main
  networks:
    - agent-network
  container_name: loki
  command: [ "-config.file=/etc/loki/local-config.yml" ]
  volumes:
    - ./entrypoint-setup/loki.yml:/etc/loki/local-config.yml
  ports:
    - "3100:3100"
As you can see, there’s a config file involved here as well. This is very basic setup, with an in-memory kvstore.
auth_enabled: false

server:
  http_listen_port: 3100

common:
  path_prefix: /tmp/loki
  storage:
    filesystem:
      chunks_directory: /tmp/loki/chunks
      rules_directory: /tmp/loki/rules
  replication_factor: 1
  ring:
    instance_addr: 127.0.0.1
    kvstore:
      store: inmemory

schema_config:
  configs:
    - from: 2020-05-15
      store: tsdb
      object_store: filesystem
      schema: v13
      index:
        prefix: index_
        period: 24h
Now, on the applications’ side, we already have SLF4J as our out-of-the-box logger for our Spring applications. To setup Loki as our log aggregator, we’ll use Loki logback appender. Here we are adding the dependency first.
implementation 'com.github.loki4j:loki-logback-appender:2.0.1'
If you already have a logback-spring.xml in your resources folder (or create one if you don’t), add the Loki logback appender in it.
<?xml version="1.0" encoding="UTF-8"?>
<configuration>
    <contextName>mcp-server</contextName>

    <appender name="LOKI" class="com.github.loki4j.logback.Loki4jAppender">
        <http>
            <url>http://loki:3100/loki/api/v1/push</url>
        </http>
    </appender>

    <root level="DEBUG">
        <appender-ref ref="LOKI" />
    </root>
</configuration>
You can now use one of Loki endpoints to verify if all the services are operational.
~ GET http://localhost:3100/services
store => Running
compactor => Running
distributor => Running
ingester-querier => Running
server => Running
query-frontend-tripperware => Running
analytics => Running
ruler => Running
cache-generation-loader => Running
memberlist-kv => Running
ring => Running
ingester => Running
query-scheduler-ring => Running
query-scheduler => Running
querier => Running
query-frontend => Running
Distributed Tracing Integration (Grafana Tempo)
For our project, Tempo is almost an overkill, but the ease of use kind of justifies it! We’ll have our Tempo instance configured first, with Zipkin as the tracing backend.
  tempo:
    networks:
      - agent-network
    image: grafana/tempo:latest
    container_name: tempo
    command:
      - -config.file=/etc/tempo.yaml
    volumes:
      - ./entrypoint-setup/tempo.yml:/etc/tempo.yaml:ro
      - tempo:/var/tempo
    ports:
      - "3200:3100"
      - "9411:9411"
The first port mapping (3200:3100, we already have Loki running on 3100) here is for Tempo, and 9411 is for Zipkin. Let’s write the configuration file now.
server:
  http_listen_port: 3200

distributor:
  receivers:
    zipkin:
      endpoint: 0.0.0.0:9411

storage:
  trace:
    backend: local
    local:
      path: /tmp/tempo/blocks

overrides:
  metrics_generator_processors:
    - span-metrics
    - service-graphs
    - local-blocks

metrics_generator:
  storage:
    path: /var/tempo/storage
  traces_storage:
    path: /var/tempo/traces_storage
  processor:
    span_metrics:
    service_graphs:
    local_blocks:
      flush_to_storage: true
      filter_server_spans: false
You could ignore the metrics-genrators here if you just wanted to monitor tracing spans, but these metrics generators help us make some TraceQL driven charts and graphs in Grafana.
On the application side, we’ll enable Aspect Oriented Programming (AOP), micrometer tracing and Zipkin dependency.
implementation 'org.springframework.boot:spring-boot-starter-aop'
implementation 'io.micrometer:micrometer-tracing-bridge-brave'
implementation 'io.zipkin.reporter2:zipkin-reporter-brave'
And, some new properties.
management.opentelemetry.resource-attributes.service.name=mcp-server
management.tracing.sampling.probability=1.0
Basically we’re sampling all requests (100%). For production systems, you might want to dial it down quite a lot! We’ll also have a bean configuration leveraging AOP.
@Configuration
public class ObservationConfig {
  @Bean
  ObservedAspect observedAspect(ObservationRegistry registry) {
      return new ObservedAspect(registry);
  }
}
Now to check if Tempo is ingesting data properly and all the different types of data it’s ingesting, you can check :3100/metrics.
Setting Up Grafana
All of our data aggregators are ready, so we’ll have our Grafana instance set up.
grafana:
  networks:
    - agent-network
  image: grafana/grafana:latest
  container_name: grafana
  ports:
    - "3000:3000"
  restart: unless-stopped
  environment:
    - GF_AUTH_ANONYMOUS_ENABLED=true
    - GF_AUTH_ANONYMOUS_ORG_ROLE=Admin
    - GF_AUTH_DISABLE_LOGIN_FORM=true
  volumes:
    - grafana:/var/lib/grafana
    - ./entrypoint-setup/grafana:/etc/grafana/provisioning/datasources:ro
This should be enough. I have disabled authentication since I’m using it locally. You can get rid of these environment variables if you want.
Aaaand, now you can access Grafana and add all the data sources from the UI.
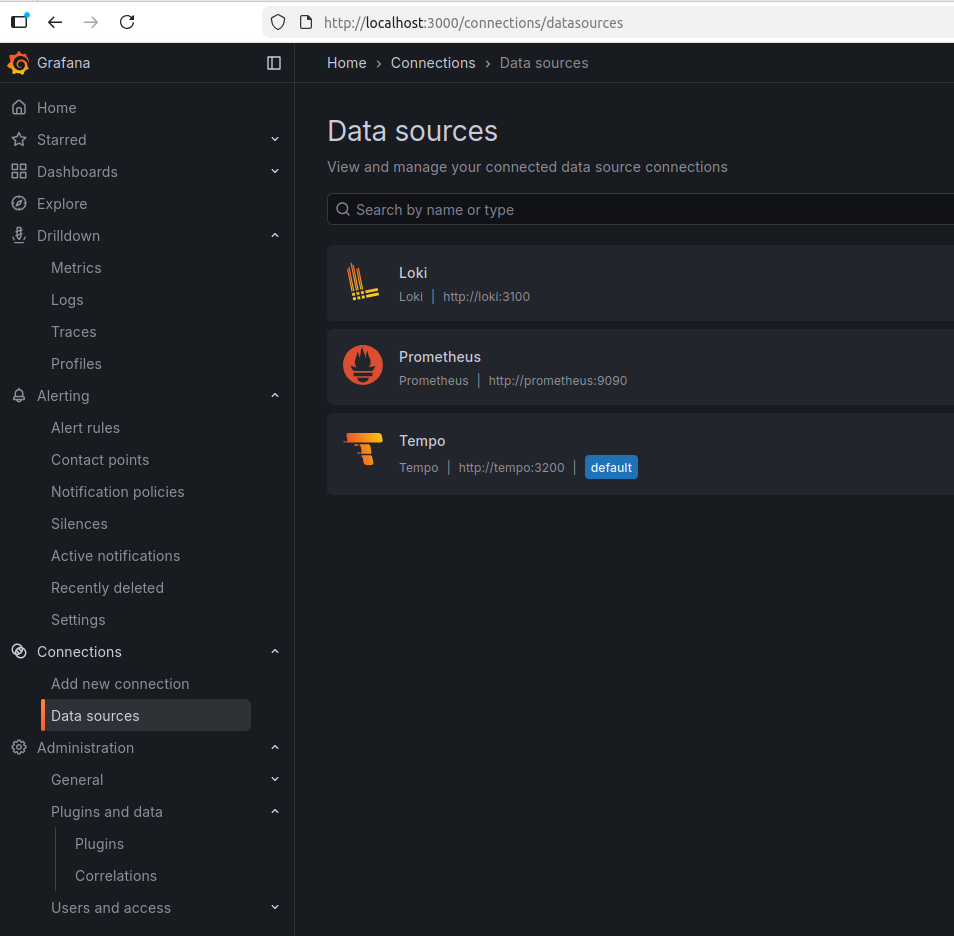
But you can also add all these in the configuration file, so that whenever you are calling docker compose up, your Grafana is ready to use!
apiVersion: 1

datasources:
  - name: Prometheus
    type: prometheus
    url: http://prometheus:9090
    jsonData:
      httpMethod: POST
      exemplarTraceIdDestinations:
        - name: trace_id
          datasourceUid: tempo
  - name: Tempo
    type: tempo
    orgId: 1
    url: http://tempo:3200
    basicAuth: false
    isDefault: true
    version: 1
    apiVersion: 1
    uid: tempo
    jsonData:
      httpMethod: GET
      tracesToLogs:
        datasourceUid: 'loki'
      nodeGraph:
        enabled: true
  - name: Loki
    type: loki
    uid: loki
    orgId: 1
    url: http://loki:3100
    basicAuth: false
    isDefault: false
    version: 1
    apiVersion: 1
    jsonData:
      derivedFields:
        -   datasourceUid: tempo
            matcherRegex: \[.+,(.+?),
            name: TraceID
            url: $${__value.raw}
That’s it! Your observability pipeline is ready to use now.
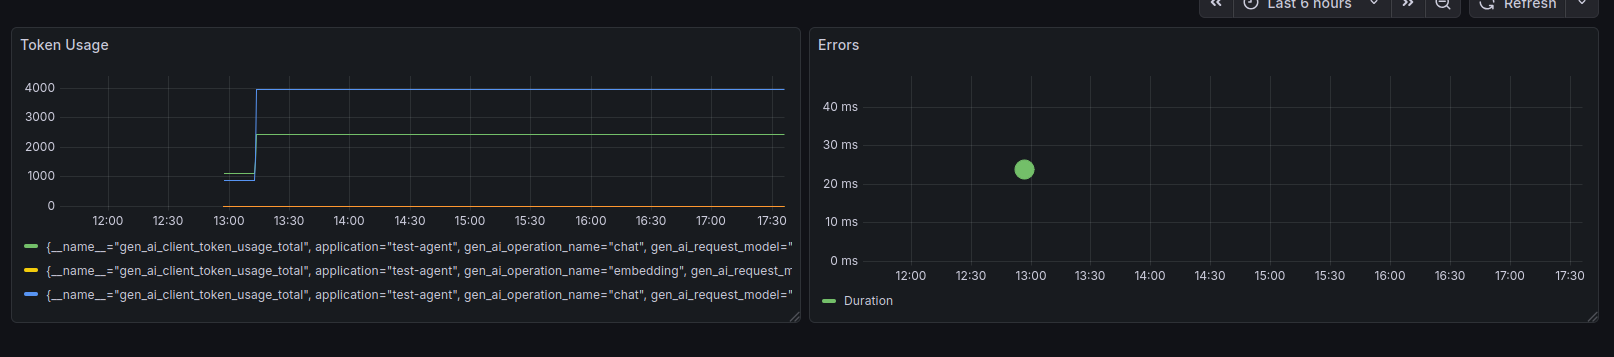
Now you can monitor all the metrics and trace data exposed by Spring AI. For example, here I’m just checking token usage and server errors.
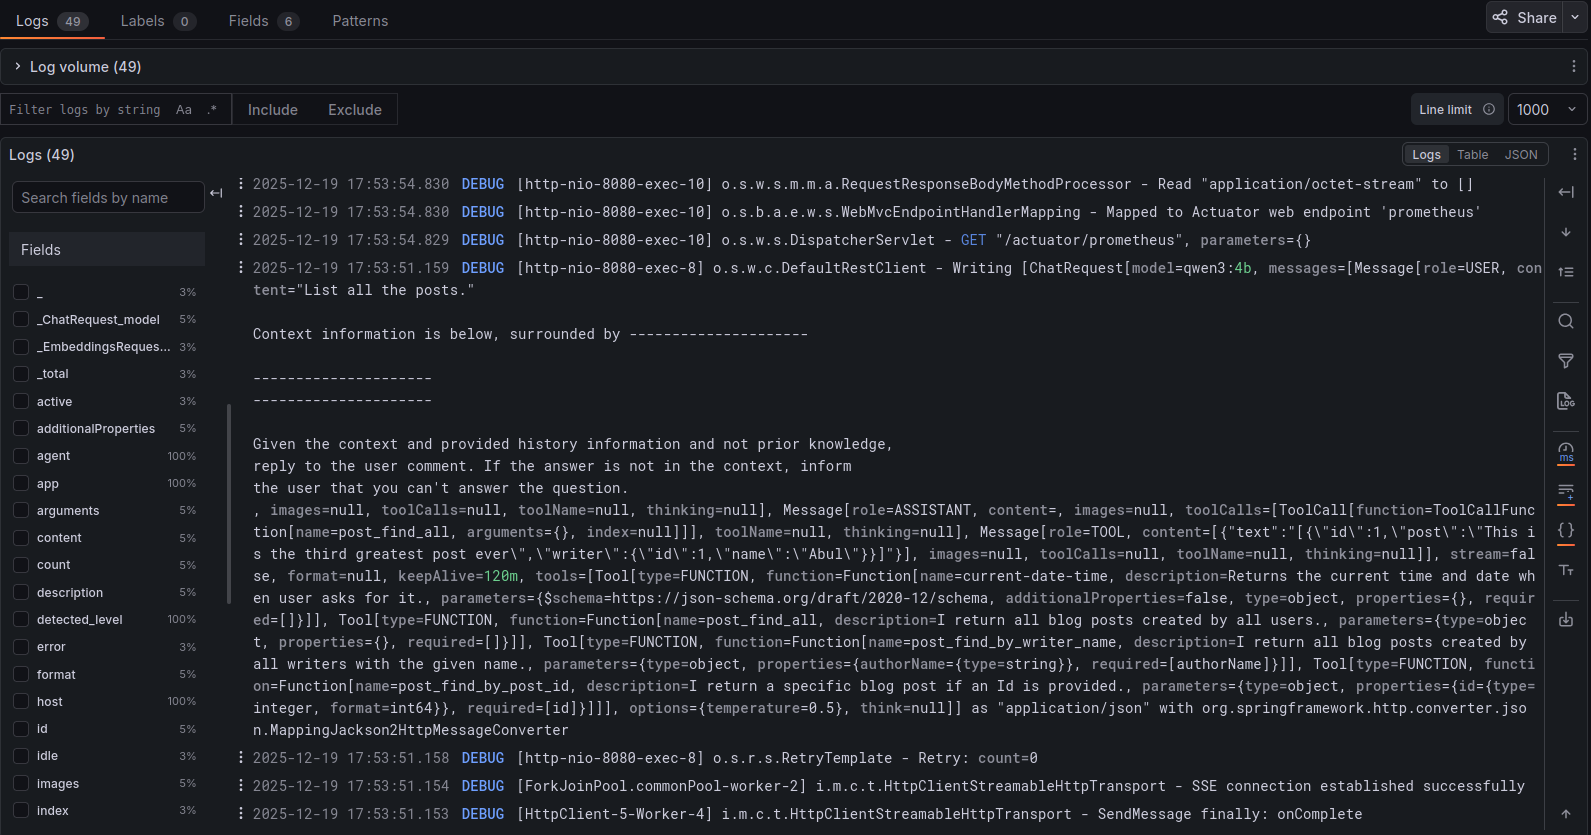
And, if we turn on all types of plain-text chat content monitoring (this should be for testing purposes only) in our client application -
spring.ai.chat.client.enabled=true
spring.ai.chat.client.observations.log-completion=true
spring.ai.chat.client.observations.log-prompt=true
spring.ai.tools.observations.include-content=true
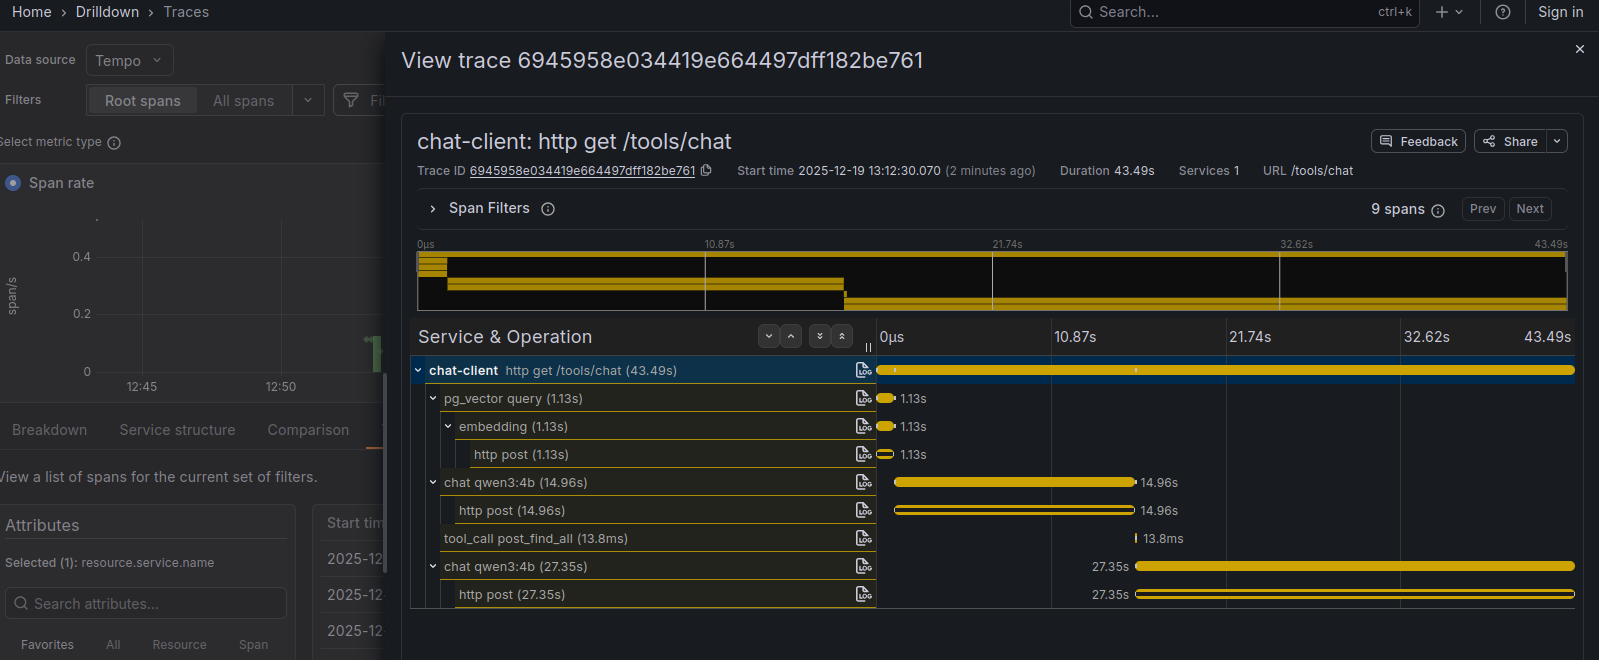
- we can find the trace id of a certain request -
- and get all the details of that request!
Tried to cover as much as possible in one blog post. This project at it’s current state is available here.
In the next one, we’ll create a frontend around this project so that we can actually use the tool that we made!